What happened
AWS announced enhanced infrastructure observability in Amazon SageMaker HyperPod, a new capability aimed at helping teams diagnose GPU training issues faster. According to the AWS Machine Learning Blog, the feature brings together diagnostic and profiling capabilities for training workloads running on both Amazon Elastic Kubernetes Service (Amazon EKS) and Slurm orchestrators.
The announcement addresses a common operational problem: when training throughput drops, the hard part is rarely noticing that something is wrong. It is figuring out why and where. Teams often spend hours or days sifting through logs and disconnected dashboards to decide whether a slowdown came from a throttled GPU, a saturated network link, or a stalled data pipeline on the host.
Why it matters
Distributed training is expensive, and small inefficiencies compound into significant wasted GPU hours. AWS states that until now, getting visibility into HyperPod infrastructure meant stitching together separate tools, and even then, the metrics told you that performance had degraded without telling you why.
The new capability is intended to isolate a single bad accelerator across hundreds or thousands of GPUs, whether through XID errors, ECC memory faults, or thermal throttling. AWS says this reduces troubleshooting time and helps keep expensive accelerators busy.
Technical details
Each capability targets a different layer of a distributed training job.
Default and advanced metrics. Enhanced observability collects telemetry at two levels. Default metrics are enabled automatically and cover cluster health, CPU/disk/OS-level usage, GPU utilization and temperature, and per-job resource utilization. These metrics are collected every 30 seconds and sent to the chosen metric store with approximately 1 to 2 percent CPU overhead and 250 to 300 MB of memory.
Advanced metrics are opt-in and provide deeper visibility: a full node exporter suite, all NVIDIA GPU DCGM and AWS Neuron metrics including clock speeds, power, PCIe activity, and error indicators, and Elastic Fabric Adapter (EFA) metrics covering network interface throughput, drops, retransmissions, and errors. AWS notes that advanced metrics increase the volume of telemetry sent to the metric store, which has a cost implication. They are described as essential for long-running training jobs on large clusters where patterns emerge over time.
Metric stores. Customers can choose between Amazon CloudWatch, now the default, and Amazon Managed Service for Prometheus. CloudWatch provides native monitoring through CloudWatch SageMaker Insights and is described as offering lower pricing compared to Amazon Managed Service for Prometheus and tighter integration with the SageMaker console. Previously, only Prometheus was supported.
Diagnostic summary. The diagnostic summary uses two complementary approaches. GPU outlier detection uses CloudWatch's DetectGroupOutliers API to compare GPUs within a training job across utilization, memory usage, temperature, power draw, and SM clock frequency. When a GPU deviates significantly from its peers, it appears as an outlier card in the diagnostic summary. This works for both EKS and Slurm jobs.
Static diagnostic rules evaluate known failure patterns and organize detected issues by type: hardware (GPU ECC memory errors, XID faults, accelerator failures), network (EFA throughput degradation, packet drops, retransmissions), throttling (GPU clock throttling because of heat, board, or reliability limits), and overheating (GPU temperatures exceeding configured limits). Each detected issue identifies the affected job, cluster, node, accelerator, and rank.
What to watch
Enhanced observability is delivered as an add-on for EKS-orchestrated clusters and as an extension for Slurm-orchestrated clusters, which means access can be controlled through AWS Identity and Access Management (IAM).
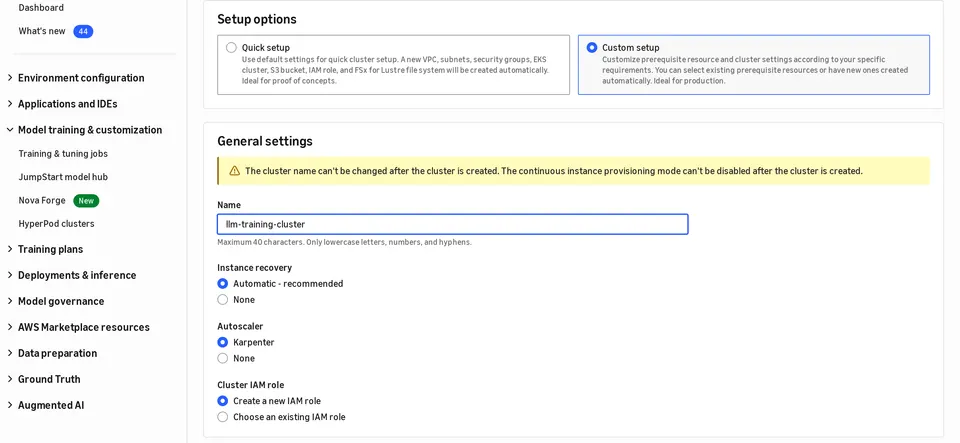
During cluster creation, the HyperPod observability section is checked by default. Users can select advanced metrics as needed and enable logging to create CloudWatch log groups for containers and pod logs. Teams running large, long-duration training jobs should evaluate whether the additional telemetry volume and cost of advanced metrics are justified by the diagnostic depth they provide.